The Sound Scanner P50 has been specially developed for visualizing medium- to high-frequency sound events. Due to its size with a measurement diameter of 50 cm, it can easily be used in confined spaces. The increased rotational speed also allows exact measurements on moving objects.
The System
The Sound Scanner is a new type of acoustic camera created by Seven Bel. The innovative system includes the following components:
- sensor unit
- mobile device
- software
- cloud infrastructure
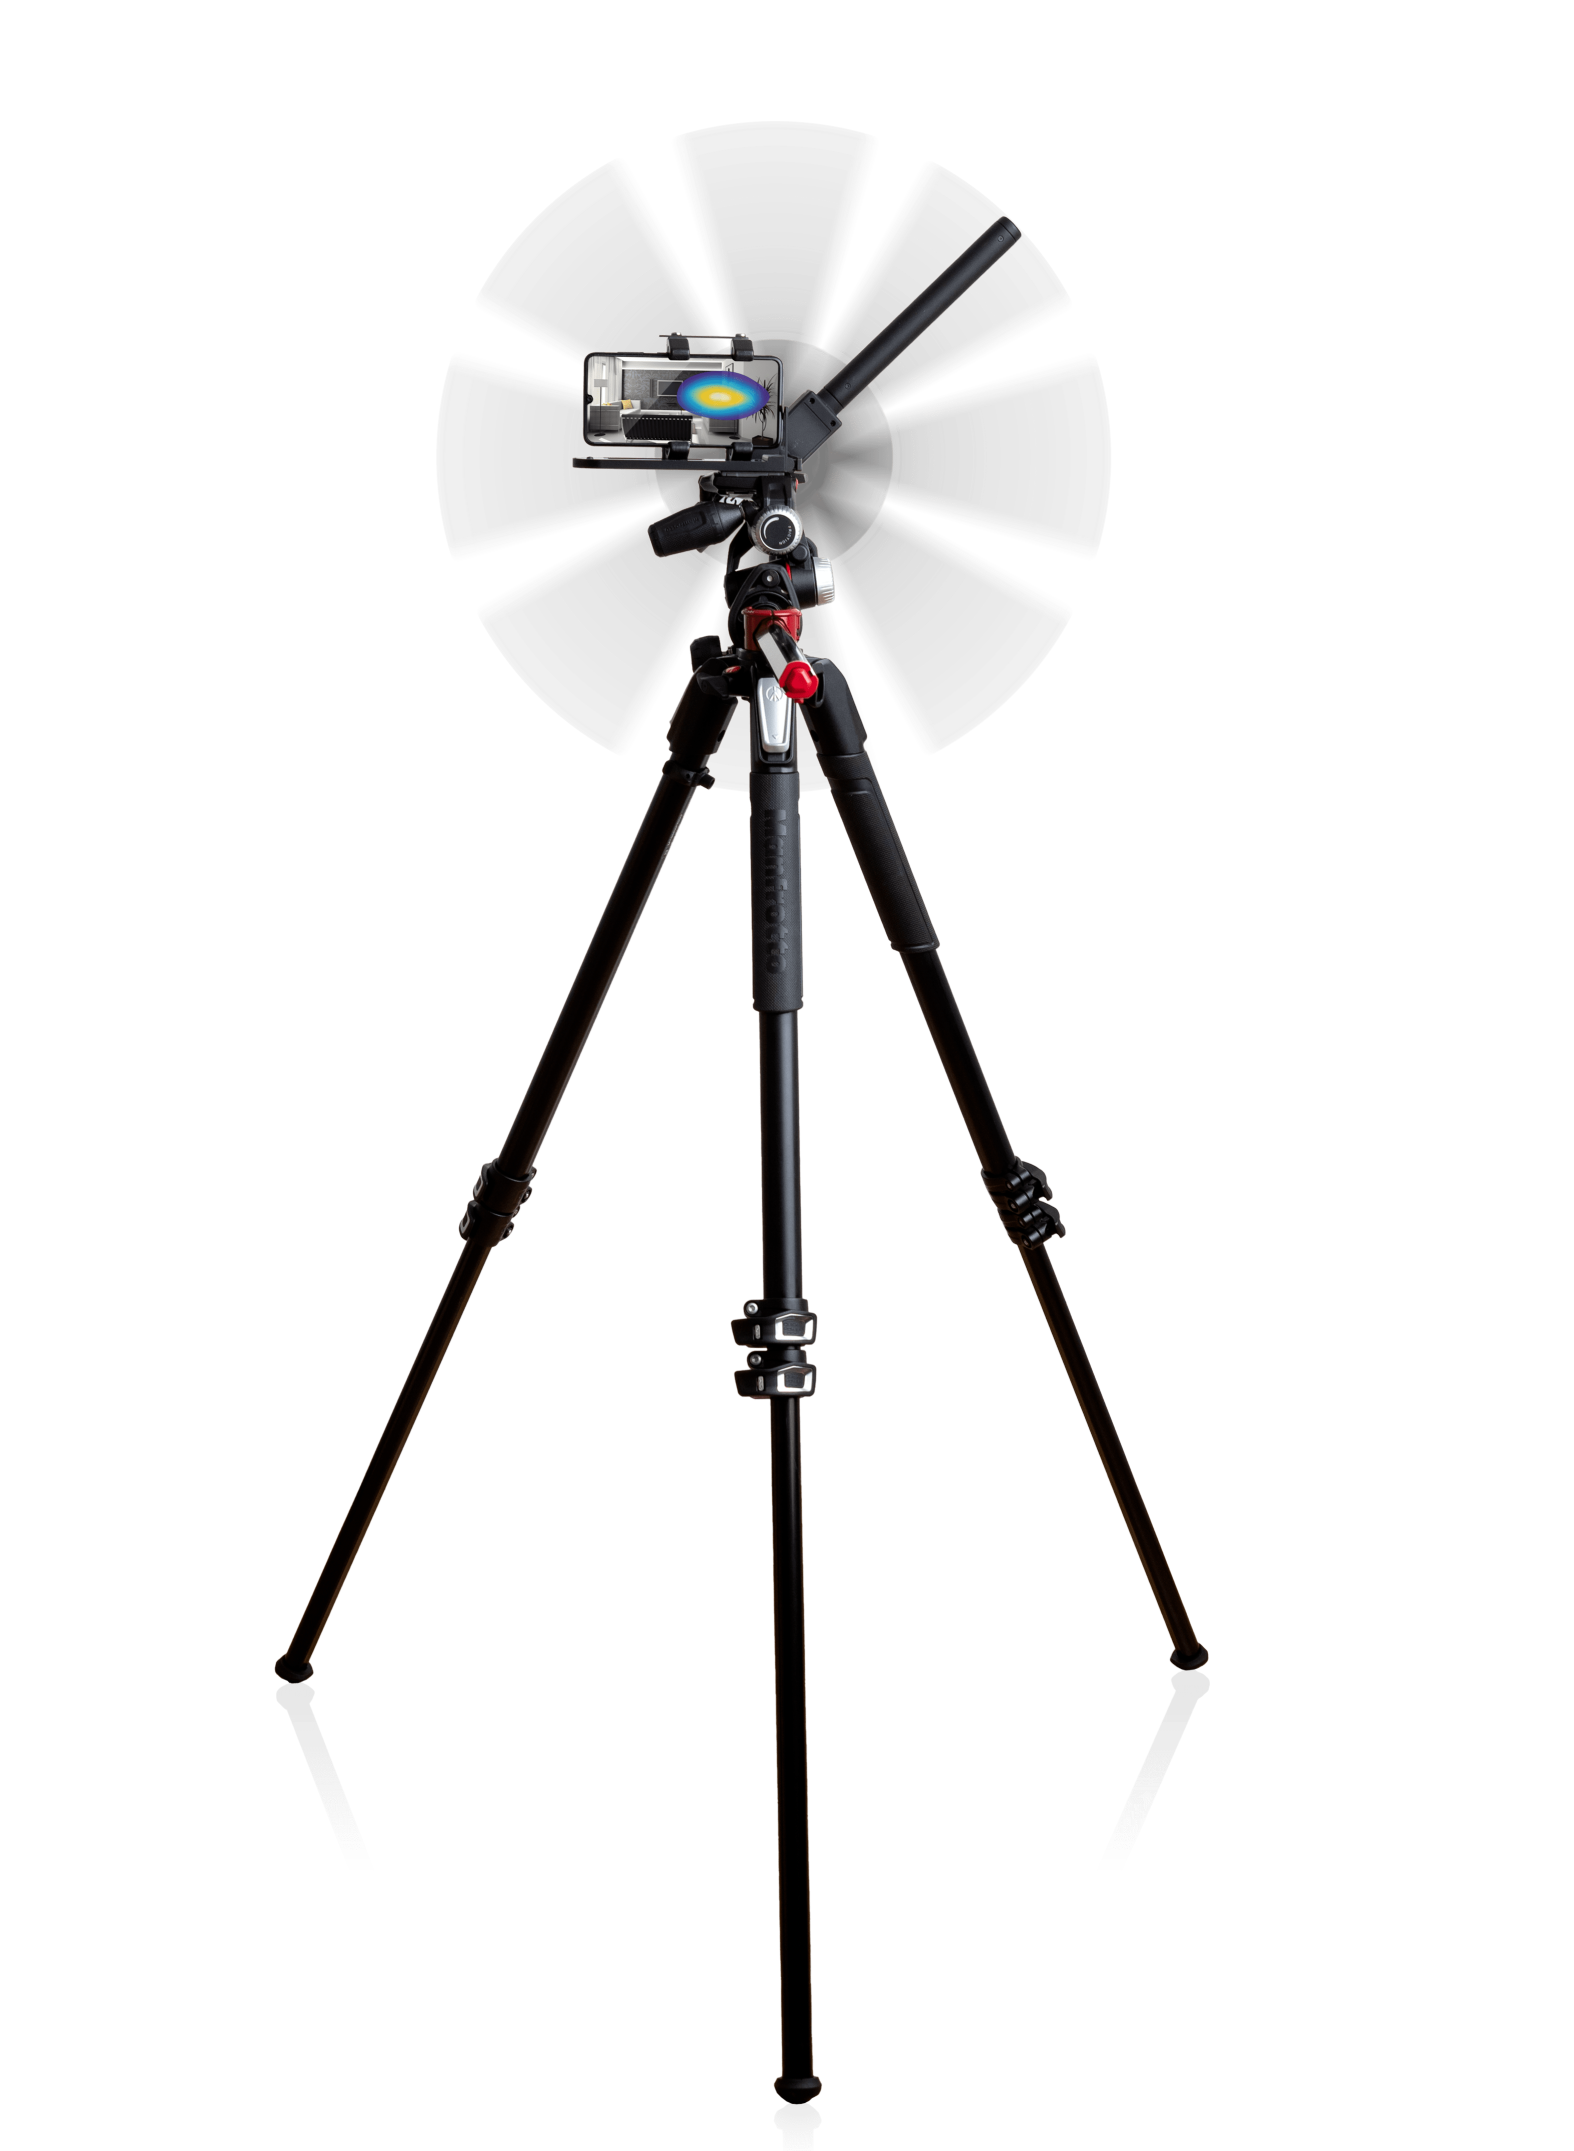
- tripod
The sensor is mounted on the tripod and set into a rotating motion during measurement. The sensor design, comprising high-quality materials such as carbon, ceramic and aluminum, is robust and operational only with a few quick and easy moves. The sensor is lightweight and compact, and can therefore be taken along for any situation.
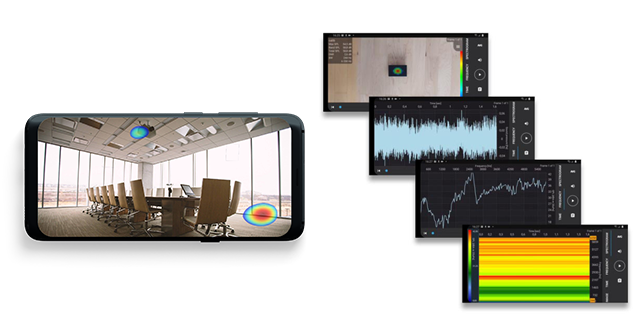
Effective Sound Imaging
Data processing works as fast as the setup. After each measurement, the mobile app transmits the collected data to our high-performance servers. Within seconds you receive acoustic images in superior image quality. Benefit from a massively simplified workflow for measuring and analyzing your sound events and share the results with your colleagues, partners or clients in the form of automatically generated reports.
Advantages compared to conventional acoustic cameras
- high-quality measurements
- quick setup
- exceptional mobility
- superior price-performance ratio
- simple operation
With the patented innovation of a moving sensor Sound Scanners are able to simulate up to 480 microphone positions on a circular area while using only five built-in microphones. Comparable acoustic cameras are normally equipped with about 100 microphones. This advantage has significant impact on the measurement quality. The unique mobility and handling and high-quality measurement results make the Sound Scanner P50 a modern high-performance measurement device that can be used and transported easily. No Laptop, power adapter or data recorder needed – more space for other things.
Sensor
50 cm
500 g
0,2 / 2 / 5 revolutions/second
5
6 hours
Acoustic image
700 Hz - 10,5 kHz
6,7 °
> 13 dB
up to 6
0,5 m - infinity
Microphone
21,5 kHz
24 bit
50 Hz - 20 kHz
+/- 1 dB
117 dB
160 dB
Analysis
- Real time display of time signal, sound pressure level in dB(A), frequency spectrum and spectrogram
- Stream/Pause mode
- Selection of time/frequency intervals and audio playback of the filtered signal
- Selection of frequency band
- Playback of filtered audio
- Single frame or time averaged frames
- Video playback
- Automated pdf report generation of single acoustic image or timed averaged images including meta data (time, location, notes, etc.), time signal, spectrum and spectrogram
- Export and import of measurements in zip format via installed file sharing apps (e.g. Google Drive)
Environmental conditions
-10 °C - 60 °C
45 % - 85 %
Mobile device
Android OS version 10.0 or higher